Thirteen strategies on a marginal edge
examples/strategy_comparison.py simulates the scenario most profitable
bettors actually live in: a marginal edge, not a big one. Every strategy
bets 5,000 rounds at a 52% win probability, a 0.95 payoff (typical -110 to
-105 odds after line shopping), a 1% transaction cost, and a full-stake
loss — an expected value of about +0.4% per bet. At an edge that thin,
the Kelly fraction is a fraction of a percent of the bankroll, variance
dominates over any realistic sample, and ruin is a live possibility. The
script runs 500 seeded simulations per strategy from a $1,000 bankroll and
records how many end in ruin.
Thirteen configurations are compared: full, half and quarter Kelly; drawdown-adjusted Kelly; Optimal F; fixed fractions at 5% and 10%; the naive expected-value rule; CPPI; dynamic bankroll management; and the Merton share at risk aversion 1, 2 and 5.
Warning
These are simulated results from a model, not a forecast and not investment advice. The simulator assumes a known, constant win probability and an independent binary outcome per bet — neither of which holds in a real book — and the edge is an assumption, not an estimate. Keeks is an educational library; treat every number below as a property of the model, not a prediction about money.
What the spread says
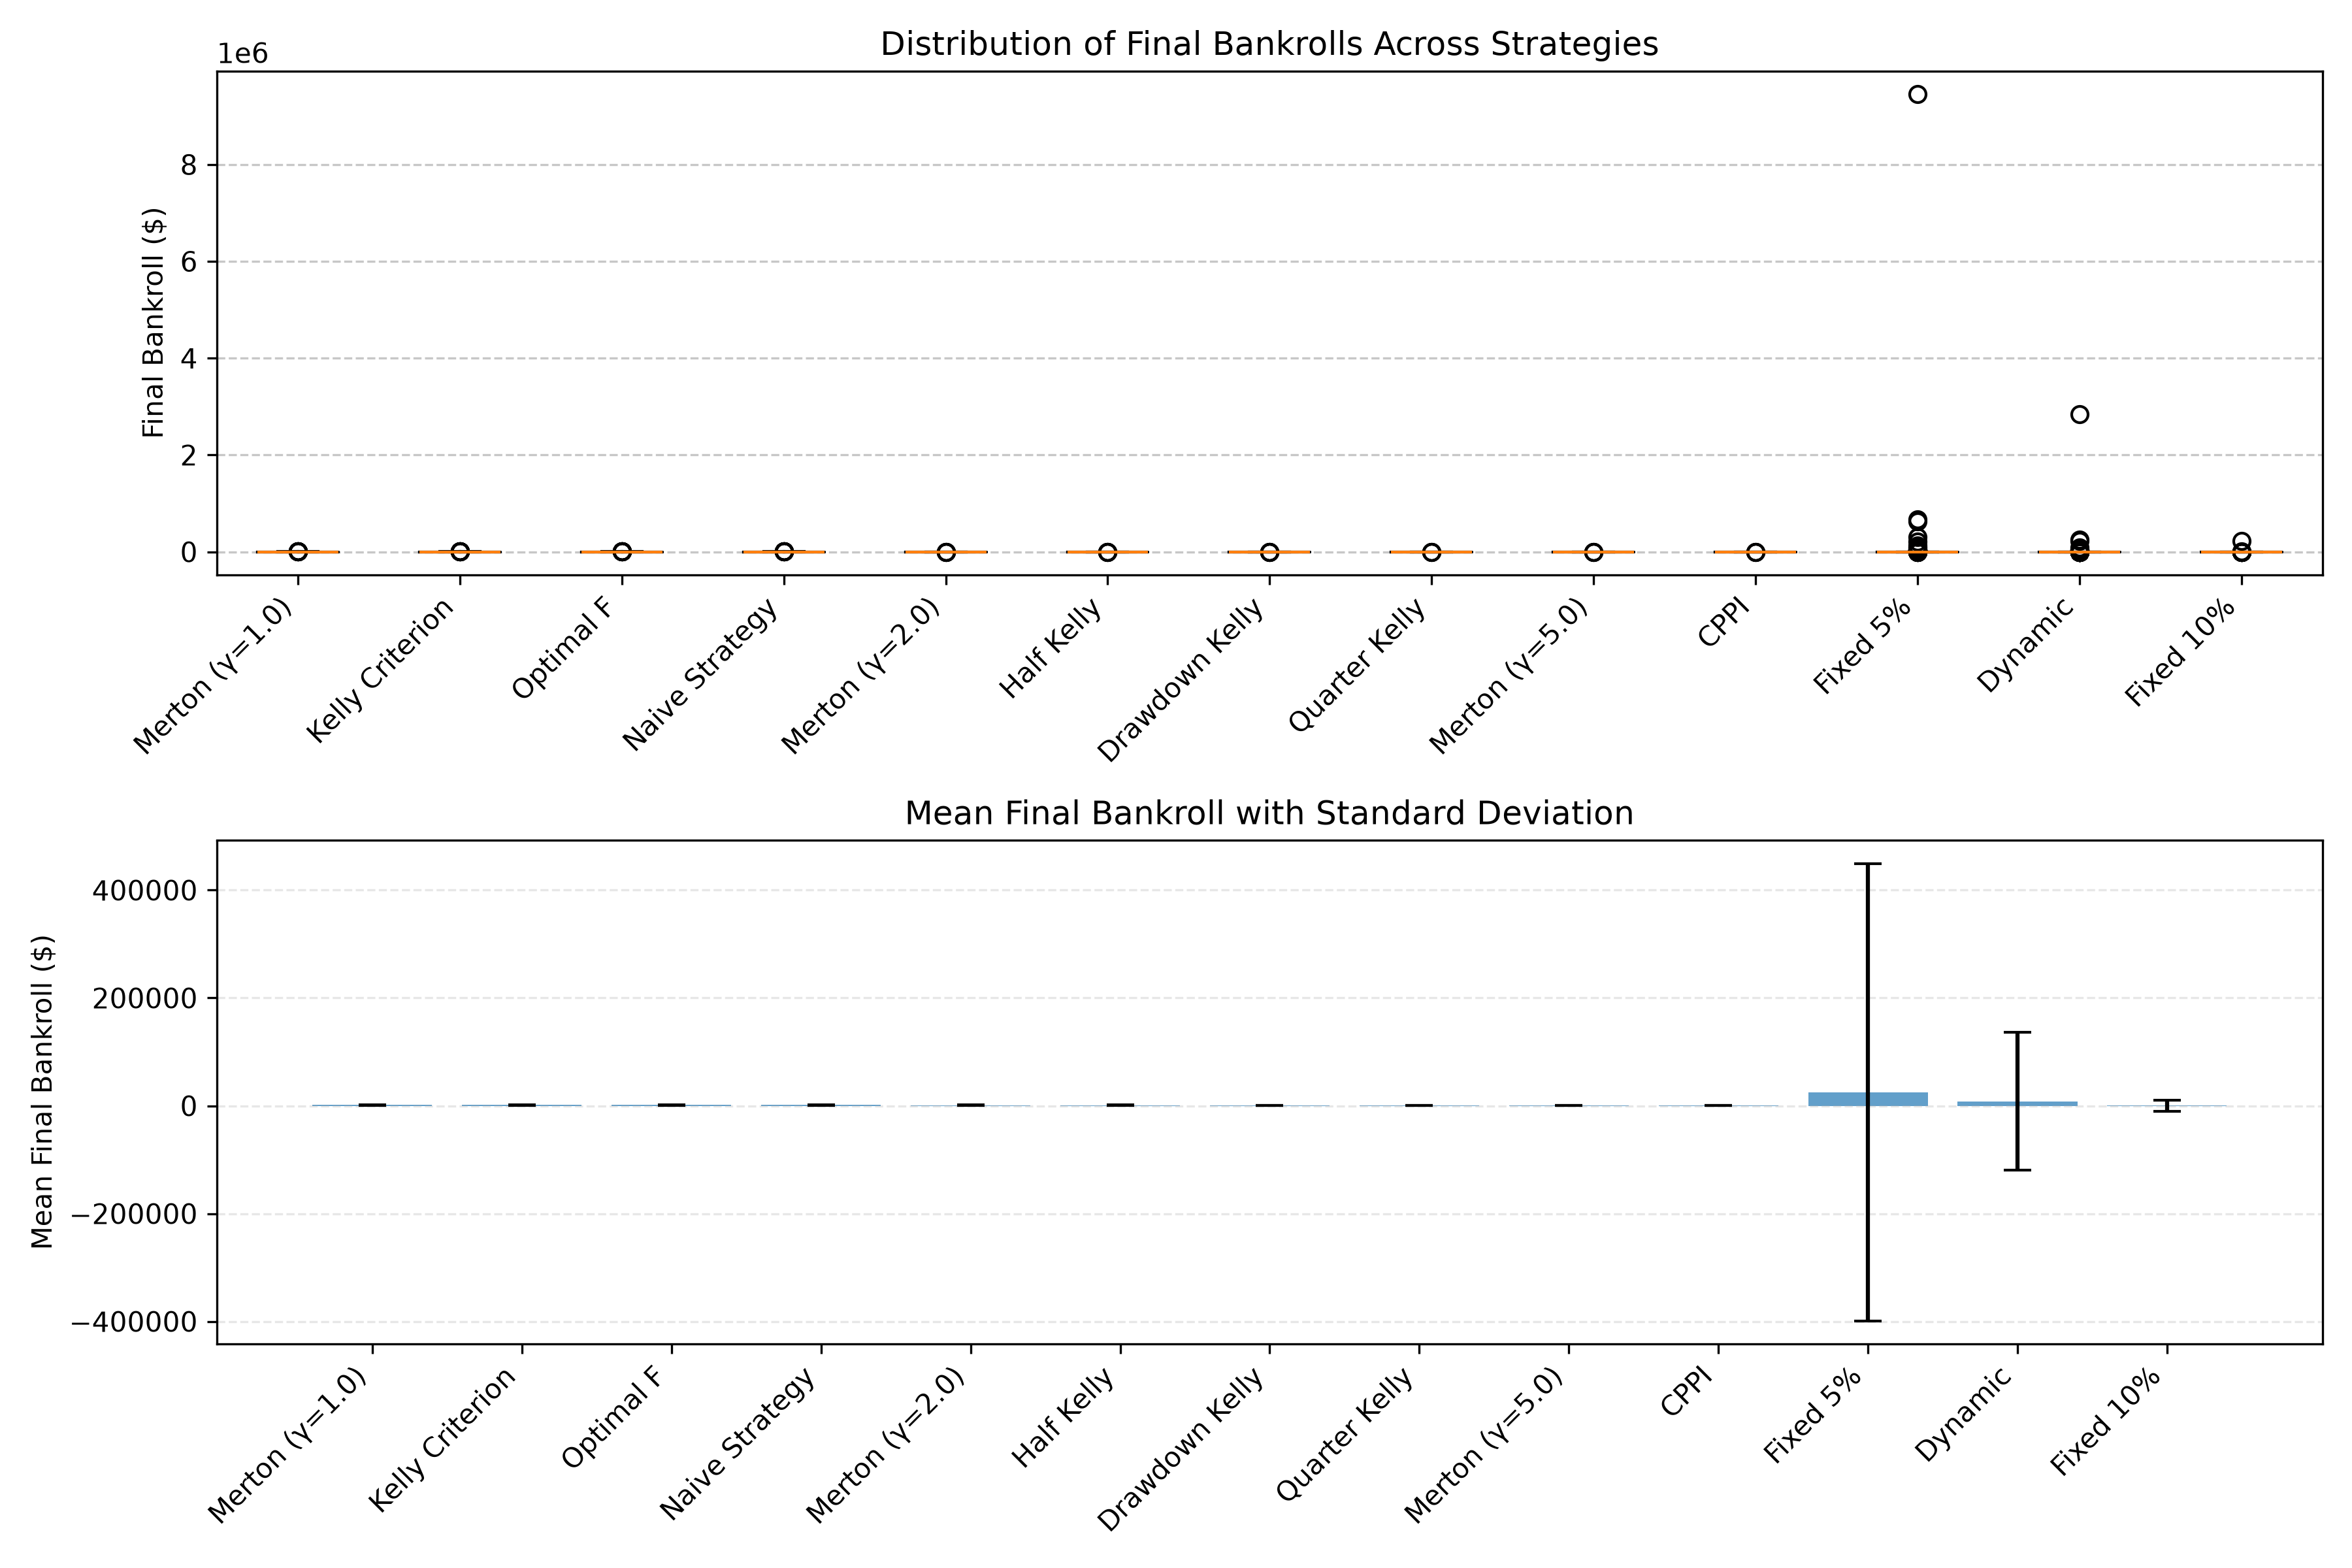
Final-bankroll distributions (top) and means with standard deviations (bottom) across 500 seeded simulations per strategy.
The two panels make the same point from opposite directions. The boxplot shows medians pinned near zero — ruin is common at this edge — with a few enormous survivors, one Fixed 5% path ending near $9 million. The mean panel shows why the mean is the wrong summary here: it is pulled upward by exactly those survivors, which is why Fixed 5%’s mean carries error bars taller than every other strategy’s entire distribution. The script prints its results table sorted by median, not mean, for this reason.
For a controlled study of the same question — how growth, drawdown and
early stops trade against each other as the edge, the cost input, the
estimate quality and the loss cap move — see the
nine-strategy benchmark, which works under
even-money assumptions in benchmarks/. This example is the messier,
more realistic cousin: thinner edge, real odds shape, and a cost model
that actually bites.
Reproducing it
One command, from a checkout of the repository:
uv run python examples/strategy_comparison.py
It runs 6,500 seeded simulations (13 strategies × 500 paths), prints the
full results table — mean, median, min, max, standard deviation and ruin
rate per strategy, sorted by median — and writes the chart plus
examples/output/strategy_comparison.csv.